Breath-Based Innovation
Breath Sensing and Analysis of Biomarkers for Disease Diagnosis
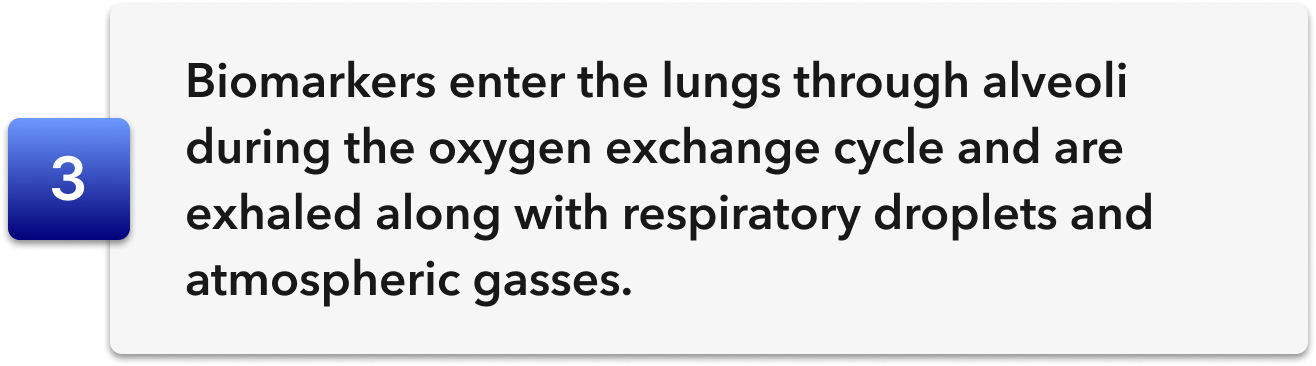
Biomarkers provide a link between exhaled breath and disease diagnosis.

TERTIARY
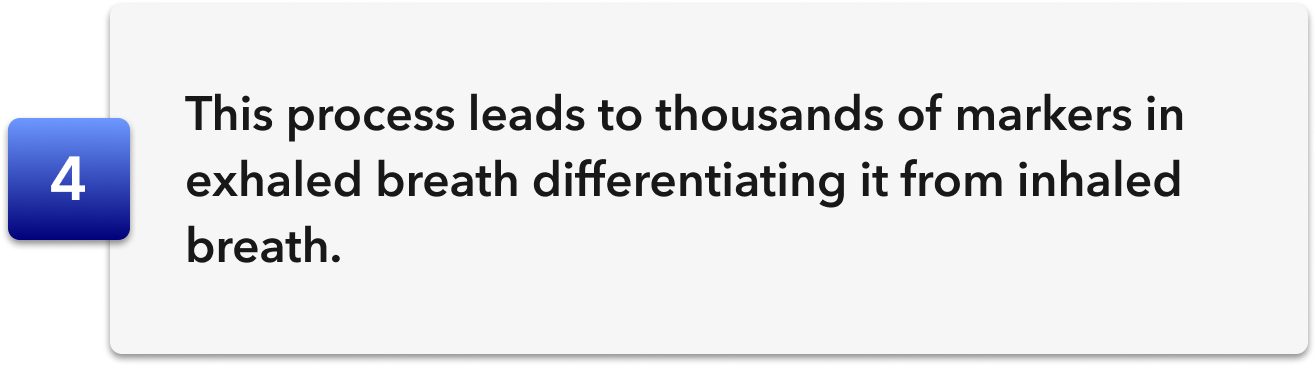
BIOMARKERS
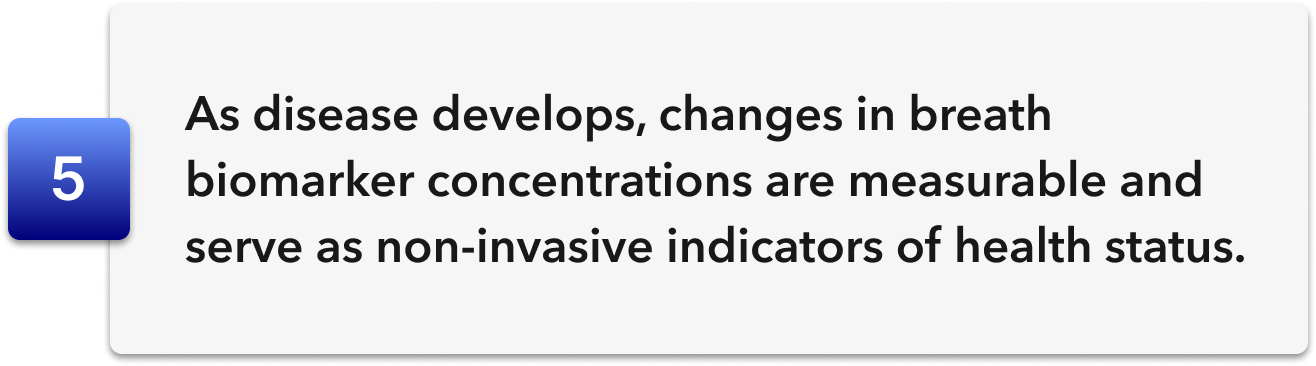
Tertiary biomarkers such as insulin resistance are byproducts of progressed disease and represent the current standard of diagnosis.

SECONDARY
BIOMARKERS
Secondary biomarkers such as volatile organic compounds (VOCs) are byproducts of a disturbance in biological function early in disease progression.

PRIMARY
BIOMARKERS
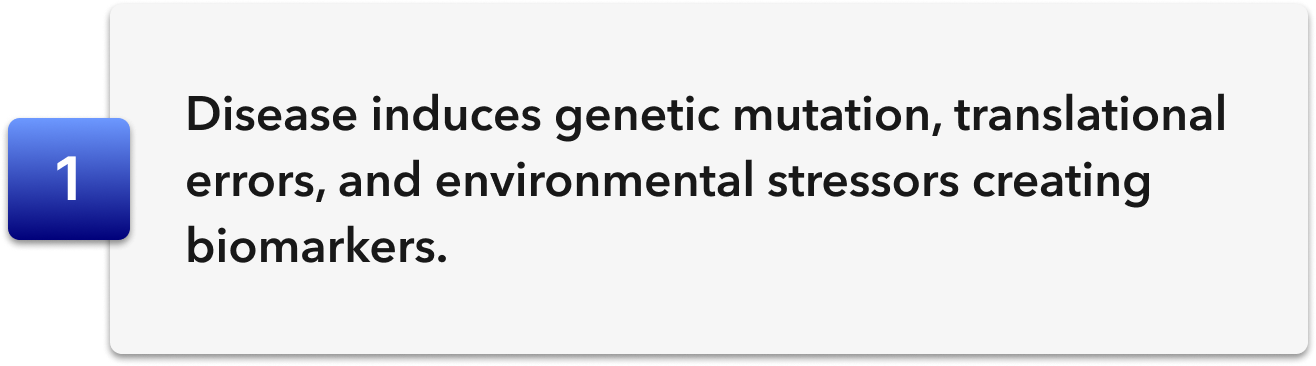
Primary biomarkers such as misfolded proteins originate from within the cells themselves at the earliest stages of disease development.

Primary and secondary biomarkers in exhaled breath provide the basis for early, non-invasive disease diagnosis and monitoring.


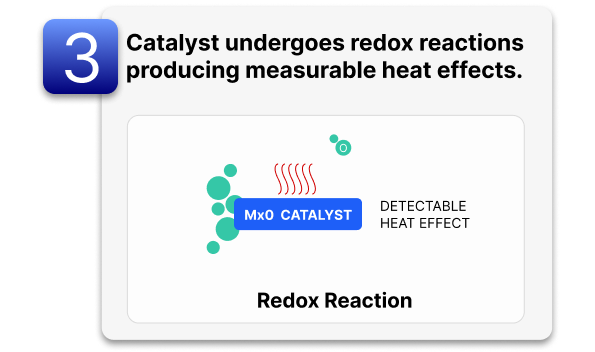

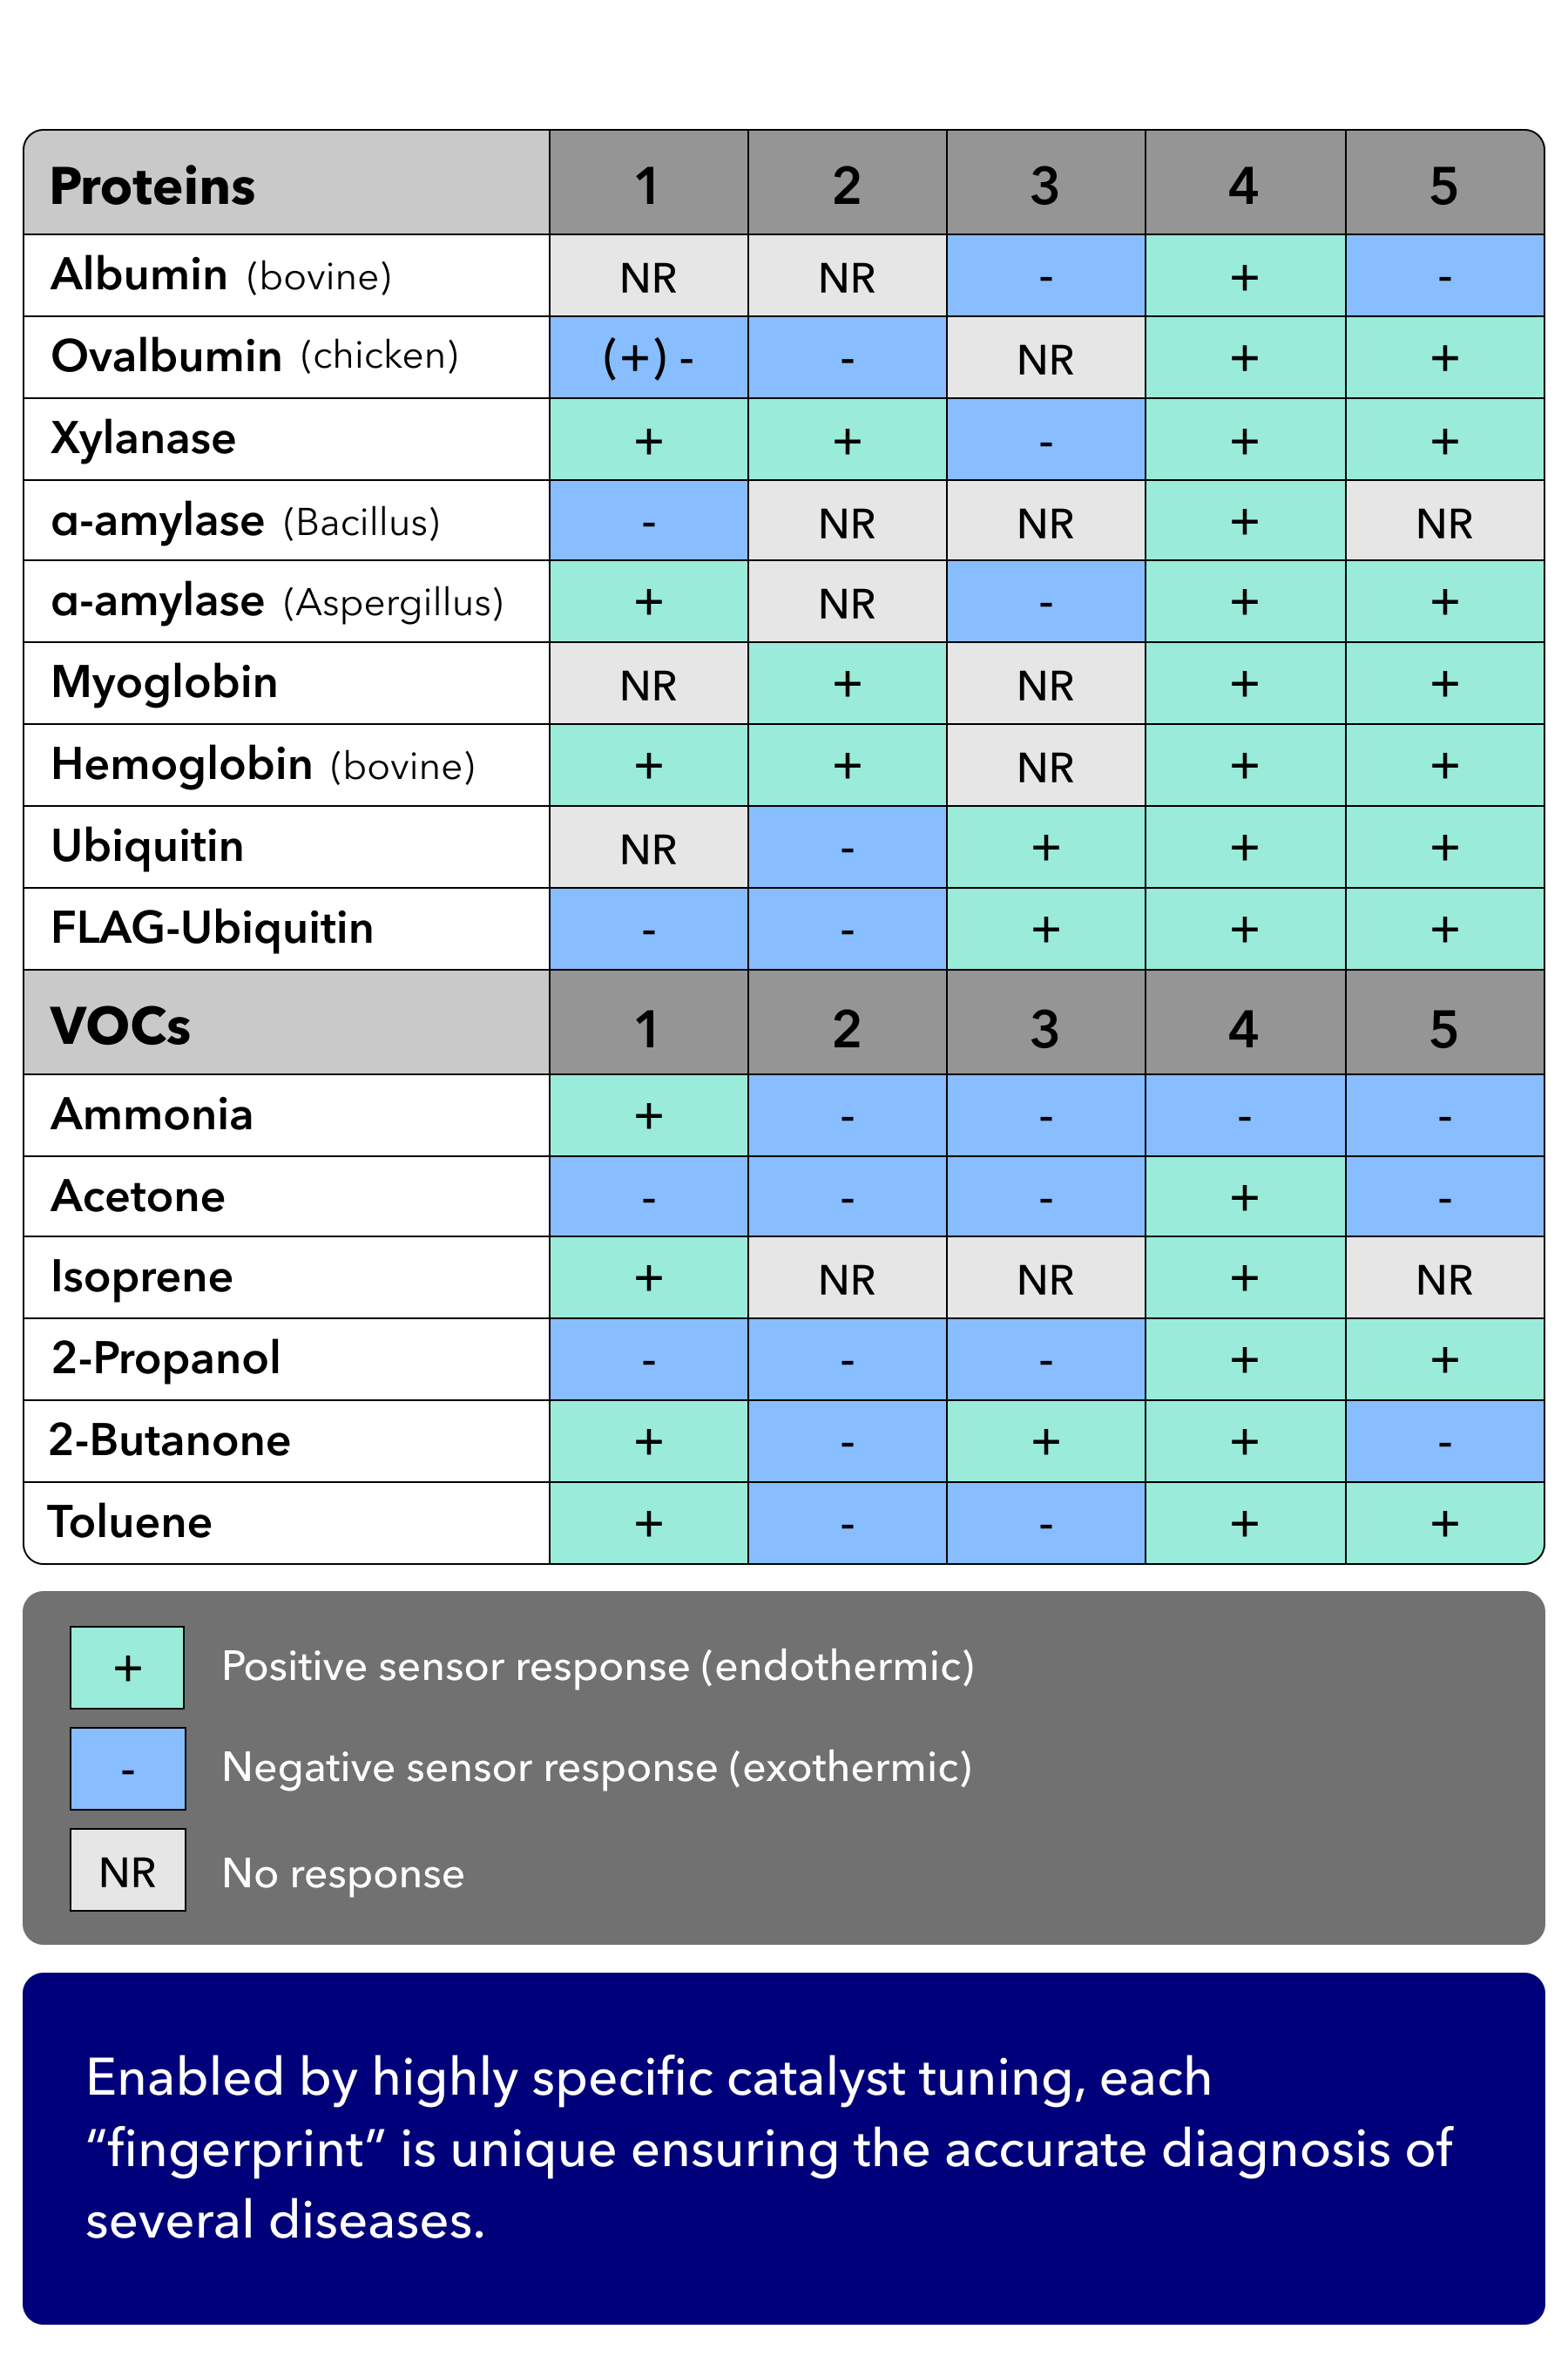
A Novel Sensing Mechanism
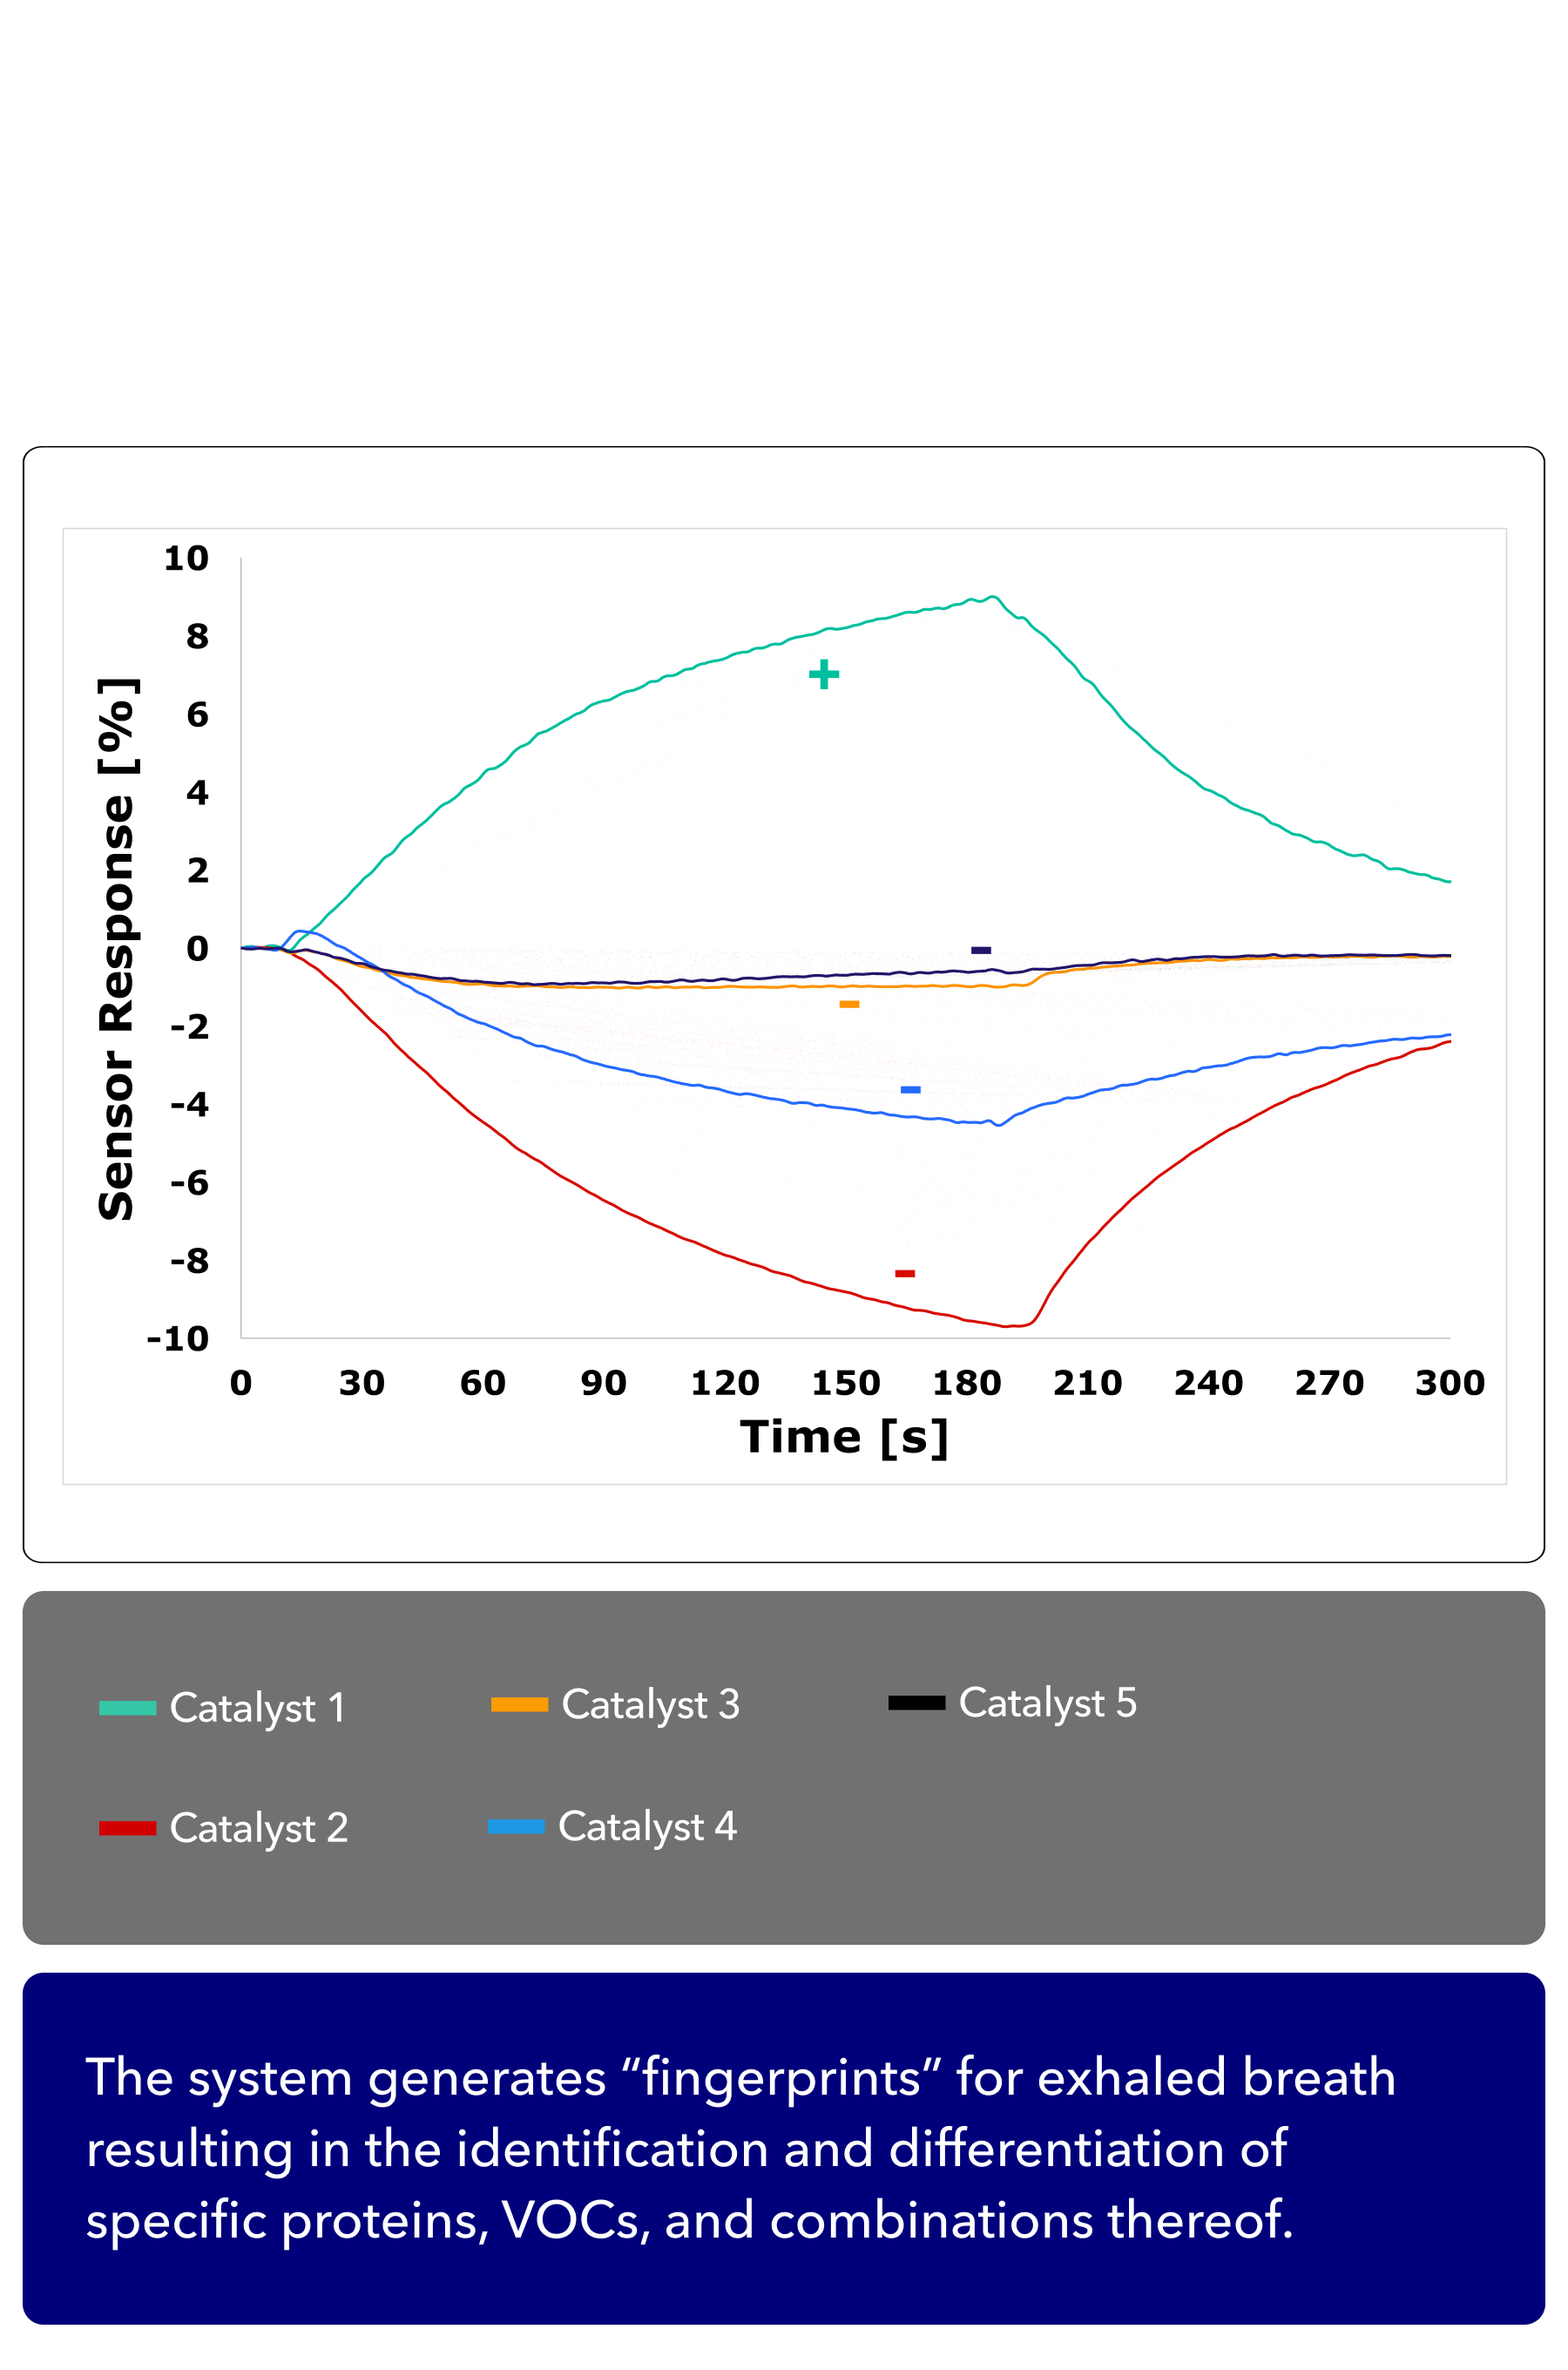
Identification and Differentiation